3. Plutosky
This page showcases measured performance for a LibreSDR acquired from OpenSourceSDRlab.
The original seller link would be: https://opensourcesdrlab.com/products/opensourcesdrlab-7020-sdr-ad9361-ad9363-development-board-with-pa-for-pluto-matlab-software-defined-radio?VariantsId=10361
My variant is AD9363 + PA
The package received contains:
1x SDR device in bubble wrap
1x telescopic antenna in bubble wrap
1x pre-flashed 128MB micro-SD card
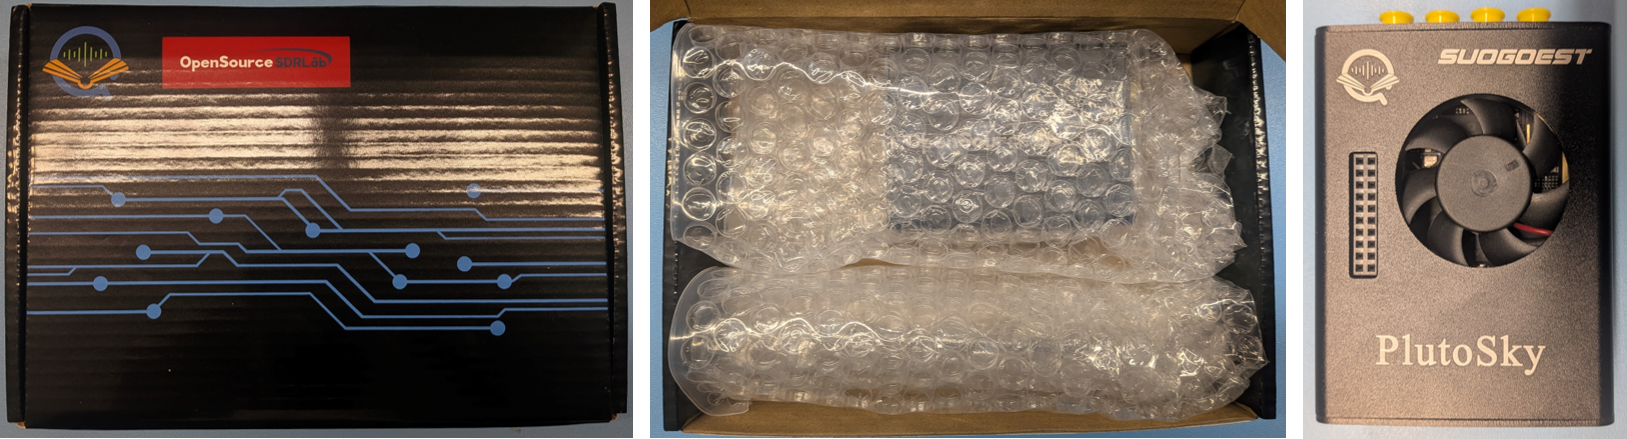
Box content
3.1. Hardware
Feature |
Description |
|---|---|
FPGA |
XC7020-2CLG400I with 2-core Cortex A9 |
RAM |
1GB 32bit wide DDR3 1066MHz |
Flash |
16MB QSPI, also support micro SD card |
RFIC |
AD9363 or AD9361 depending on the flavour |
ADC/DAC resolution |
12 bits |
Max Sampling rate |
61.44 Msps |
Max bandwidth |
20 MHz (AD9363) or 56 MHz (AD9361) |
Frequency range |
325~3800 MHz (AD9363) or 70~6000MHz (AD9361) |
Clock |
TCXO 40MHZ 0.5ppm + external clock input |
Connections |
USB 2.0 OTG + USB debug (Serial) + Gigabit ethernet. USB connectors are Type C |
Misc |
GPIO header |
Schematics and firmware can be found in OpenSourceSDRLab github, although the schematics in the repo does not have the PA so it might not be the latest revision. Another schematics with the PA can be found here, but it’s missing a page with power supplies… I guess by merging the two one can get the full schematics.
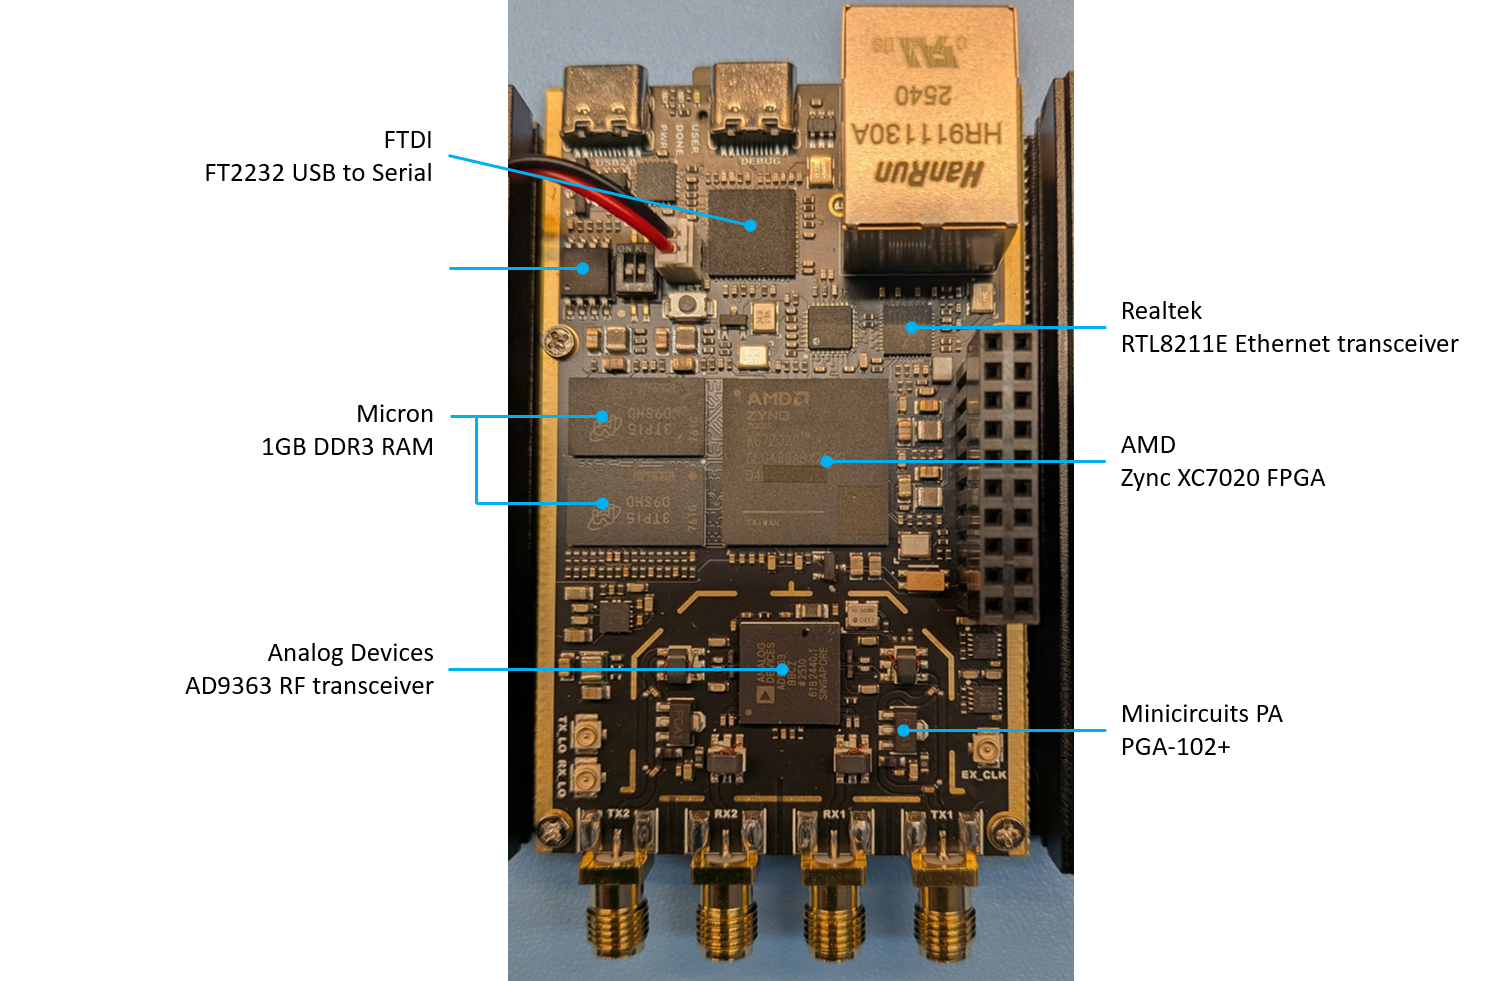
Plutosky typical PCB
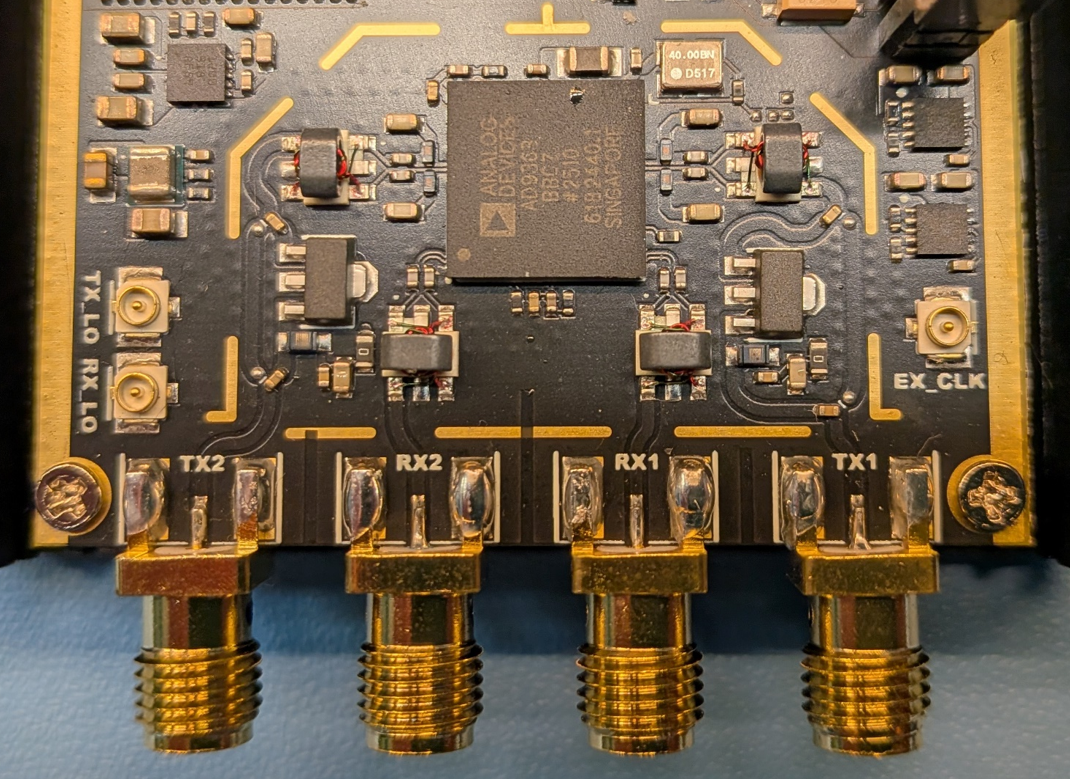
Plutosky RF section close-up
Interestingly, the FPGA in my product has had its markings lasered-off. This normally does not instill confidence… but the device works:
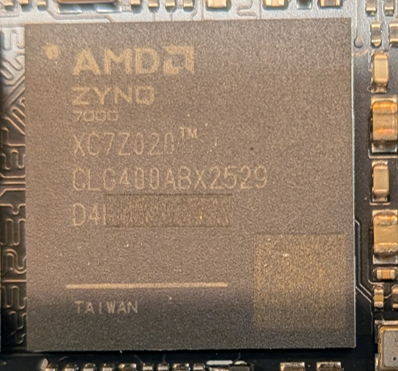
Plutosky FPGA
Mechanically the device comes in a metal enclosure, with a fan. The fan is loud, which is annoying compared to a fully passive (and silent) LibreSDR, but it is needed: upon opening the device it appears that the PCB is thermally isolated from the metal enclosure. It is mounted on plastic pillars and has no contact with the enclosure, hence the need for a fan.
Since they went through the trouble of making a metal casing, I feel there was a missed opportunity to make the PCB a tiny bit larger and find a way to couple it thermally to the casing.
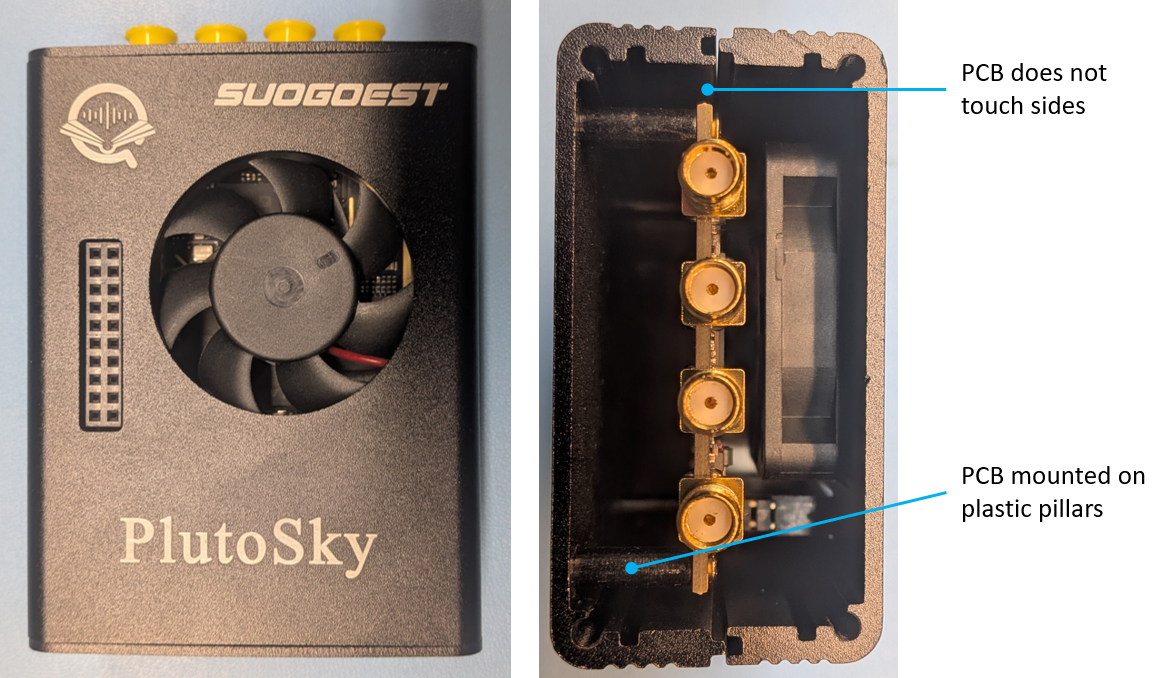
Plutosky casing
Performance data given below is for the default configuration of my device (as I received it):
AD9363 mode (325-3800MHz / max BW 20MHz)
1RX + 1TX
All tests:
Are conducted using the USB connection. This would NOT affect high-bandwidth measurement as IQ data was taken as “one-shot”, not continuous streaming.
Have setup cable loss deembedded from the measurement: the reference plane is the device’s SMA connector
3.2. Firmware
My devices came with a default firmware dubbed “v0.38-1-g6f8e-dirty”.
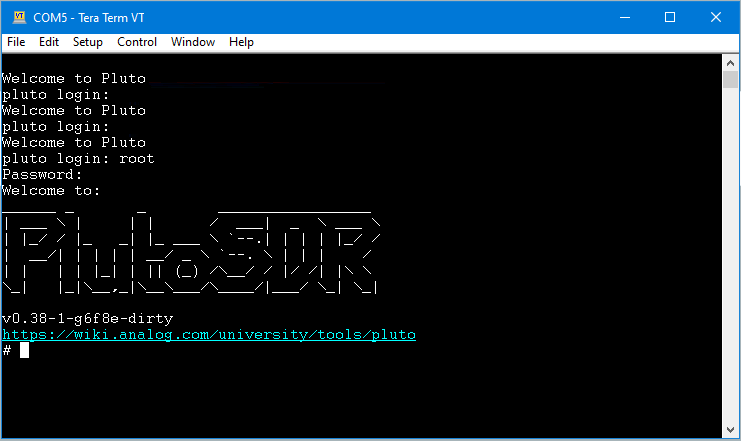
Plutosky default firmware
Unlike LibreSDR the device cannot boot seamlessly from Flash or SD card when inserted; it has to be manually configured with a dip-switch:
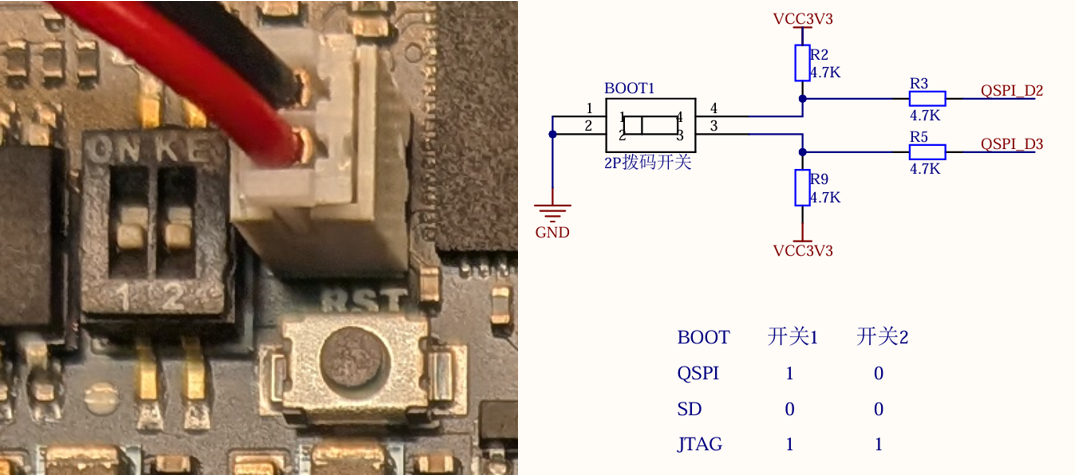
Plutosky boot switch
By default my device is configured to boot from SD card. The Flash contains the same image as the SD card provided by the seller.
The firmware:
Is in “AD9363” mode, ie limited to the standard frequency range of 325-3800MHz / 20MHz bandwidth
Is configured in 1TX-1RX only (so TX2 and RX2 port unusable)
Note
At the time of writing I have not tested ethernet yet, only USB
3.3. Typical test setup
The typical test setup is simple: the port under test is connected to the test instrument with an RF cable, and a 6dB attenuator is placed at the device’s SMA connector to tame any mismatch introduced by the RF cable.

Typical test setup
Setup cable loss has been characterised and is removed from the test results.
3.4. Port impedance
Test conditions:
Configuration |
RF port |
TX1 or RX1 port enabled |
||
Sampling rate |
1Msps |
|||
Tx Gain |
0dB |
|||
Rx Gain |
70dB |
|||
LO |
1GHz |
|||
Parameter sweep |
None |
|||
The TX or RX port is connected to a VNA and S11 is measured

Port impedance setup
Test results:
From the plots we can see that
RX S11 looks ~OK from ~1100 MHz, but is generally not great
TX S11 looks looks good everywhere, owing to the monolithic PA
3.5. RX tests
3.5.1. Rx Frequency response
This test measures the frequency response of the receive chain
Caution
There are 3 frequency ranges defined in the Analog Devices documentation, each with a different RX gain table:
RX LO |
Min GAIN |
Max Gain |
|---|---|---|
70 … 1300 MHz |
-1 dB |
73dB |
1300 … 4000 MHz |
-3 dB |
71 dB |
4000 … 6000 MHz |
-10 dB |
62 dB |
Test conditions:
Configuration |
RF port |
RX1 |
||
Sampling rate |
1.024 Msps |
|||
SG level |
-15/-20 dBFs @ gain = 0dB |
|||
Tone frequency |
LO+100kHz |
|||
Rx Gain |
0 dB |
|||
Rx buffer size |
2048 |
|||
Parameter sweep |
Rx Gain, LO frequency |
|||
Initial condition:
The signal generator is set to transmit a tone at LO+100kHz
The signal generator level is set to get circa -20dBFs at the receiver with a gain of 0dB (ie very strong but not so strong that we saturate the rx)
Sweep:
At the start of each new frequency range: The dBm scale is calibrated using the 1st frequency of the active frequency range
Sweep frequency and at each step the RX level in dBm is measured, using RSSI
Note
The final result is normalised to the level of the very 1st frequency
Test results:
Only two gains were measured: min and max to check if there was any dependency.
The frequency response looks very similar with both gains
There is significant rolloff after ~2500 MHz, consistant with the S11 response
The response roughly tracks the RX S11 where
S11 improves until 2500 MHz, and frequency response is somewhat flat.
Then S11 degrades and reaches its worst point at around 3300-3800 MHz, which corresponds to the lowest region on the frequency response.
3.5.2. Rx Gain
This test measures the Gain of the receive chain. What we report is the gain error: it shows us gain linearity at the same time.
Test conditions:
Configuration |
RF port |
RX1 |
||
Sampling rate |
1.024 Msps |
|||
SG level |
-80dBFs @ gain = 0dB |
|||
Tone frequency |
LO+100kHz |
|||
Rx buffer size |
2048 |
|||
Parameter sweep |
Rx Gain, LO frequency |
|||
Initial condition:
The signal generator is set to transmit a tone at LO+100kHz
The signal generator level is set to get circa -80dBFs at the receiver with a gain of 0dB
Sweep:
Sweep gain, RX level in dBFs is measured using an FFT at each step
The Gain error for each step is found by comparing level measured at Gain G vs level measured at Gain 0dB
Note
The final result is normalised to the gain of 0dB
Test results:
The Gain Error remains small across the whole gain range and across frequency.
It seems to be slightly more consistent than LibreSDR, especially at lower frequencies
Tt exhibits similar “chaotic” traits as LibreSDR: it jumps around quite a lot over the full gain range
3.5.3. Rx Bandwidth filter response
This test measures the frequency response of the baseband filter that sets the bandwidth
Test conditions:
Configuration |
RF port |
RX1 |
||
LO |
1000 MHz |
|||
SG level |
-20dBFs @ gain = 0dB |
|||
Tone frequency |
LO+100kHz |
|||
Rx buffer size |
2048 |
|||
Sampling rate |
min(3*BW, 30) MHz |
|||
Parameter sweep |
Rx Bandwidth |
|||
Initial condition:
The signal generator is set to transmit a tone at LO+100kHz
The signal generator level is set to get circa -20dBFs at the receiver with a gain of 0dB
Sweep:
While the signal generator frequency is kept constant, the RX LO is swept across the entire bandwidth of the filter (and a little more)
Measurement is done in dBFs using an FFT at each step
The FFT bin where the tone is expected is computed, and tone level measured
This methodology allows us to get a result that is independent of front-end loss
Note
The final result is normalised to the center frequency of the filter
Test results:
We get the exact same result as LibreSDR (expected as this is purely a characteristic of the RFIC)
We see a ripple in the filter response. Manual check shows it is real, not a measurement artifact. On wide bandwidths the passband ripple gets quite large, around 1.5dB
Filters at 250 kHz and 300 kHz BW look very similar and are too wide
3.5.4. Rx Noise figure
This test measures the noise figure of the entire receive chain
Test conditions:
Configuration |
RF port |
RX1 |
||
LO |
1000 MHz |
|||
SG level |
-80dBFs @ gain = 0 dB |
|||
Tone frequency |
LO+100kHz |
|||
Rx buffer size |
2048 |
|||
Rx Gain |
70 dB |
|||
Parameter sweep |
Rx Bandwidth, Rx LO |
|||
By lack of noise source or any specialised equipment, I used the gain method to measure NF. It is theoretically possible since the maximum RX Gain is very high (~70dB), assuming thermal noise dominates. It is a “quick and dirty” method but should yield acceptable results.
The idea is to measure noise power while RX is terminated with 50R at maximum gain, and apply the formula:
Initial condition:
The signal generator is initially set to transmit a tone at frequency RX LO + 100kHz
The signal generator level is set to get circa -80dBFs at the receiver with a gain of 0dB
Sweep: For each frequency,
(Max) Gain and dBm scale are calibrated using the signal generator
Once Gain and dBm scale are calibrated, the signal generator is turned off
The total noise power in dBm at the receiver is measured using an FFT
Finally the NF formula given above is applied
Note
The test has been run with only the RX active
Warning
This test was not run in shielded environment.
Test results:
The results are quite reasonable, and better than LibreSDR. LibreSDR exhibits heavy degradation above ~2600 MHz whereas Plutosky maintains much more constant NF across the range. For this type of device we should expect between 4-8 dB of Noise Figure, which is exactly what we get.
We do see discrete degradations which could be due to external interference. I ran the test multiple times and they stay present so they could also be real internal noise.
Todo
redo measurement in shielded environment to check if degradations are internal or external
3.5.5. Rx Spurious emissions
Spurious emissions measure the noise at the RX input, in other words what leaks out of the receive port and seen by the outside world. For this we use a slightly different setup: the TX transmits into a 50R load while we observe the RX port with a spectrum analyser using a wideband scan.

RX spurious emissions setup
Four configurations are tested:
RX only: The TX synthesizer is OFF
RX + TX Idle at Max TX Gain: the TX synthesizer is ON but not transmitting
RX + TX Idle at Min TX Gain: the TX synthesizer is ON but not transmitting
RX + TX Active: the TX synthesizer is ON and transmitting: This 4th case is effectively the TX to RX isolation at PCB level
Test conditions:
Configuration |
RF port |
TX1 / RX1 |
||
Sampling rate |
5 Msps |
|||
TX Tone frequency |
LO + 1 MHz |
|||
TX Tone level |
-6 dBFs |
|||
Tx Gain |
0 dB (max gain) or -80dB (min Gain) |
|||
Tx LO |
613 MHz |
|||
Rx LO |
513 MHz |
|||
Parameter sweep |
Rx Gain |
|||
Initial condition:
RX lo is fixed at 513 MHz
If enabled the TX Gain is set to max, tone offset +1 MHz and LO = 613 MHz
Sweep:
Min and Max Rx Gains are tested
For each gain a wideband scan is done at the analyser side.
Test results:
3.5.5.1. RX only
Both Gains give us similar plot. Given the scale we can consider that we see nothing. There are two distinct spurs at 2666 MHz and 3840 MHz. 2666 MHz could be RAM related as it falls in the DDR3 clock domain but it could also be external.
3.5.5.2. TX Synth ON - Max TX Gain
The TX synthesizer is ON, set at Max TX Gain but not transmitting. At 0dB Rx Gain we now see the TX VCO fundamental at \(4 \times 613 MHz = 2452 MHz\) and its H2. However at 70dB RX Gain the TX VCO fundamental is suppressed while its H2 is not.
3.5.5.3. TX Synth ON - Min TX Gain
The TX synthesizer is ON, set at Min TX Gain but not transmitting. At both RX Gains the TX VCO fundamental and it H2 are now much lower
Hint
If you must keep the TX synthesiser ON but are not actively transmitting, set the TX Gain to minimum to reduce spurs
3.5.5.4. TX Active
Note
This last case looks at TX/RX RF coupling between the SMA and the chip boundary: it gives us the TX/RX isolation on the PCB
The transmitter is turned ON: we now see a LOT more spurs at multiples of the TX LO and TX VCO. This is much worse than LibreSDR, because we now have an external PA that amplifies and/or produces a lot of very strong spurs.
The VCO fundamental at 0dB Gain is at approx. -65 dBm, similar to LibreSDR.
Focusing on the region around the LO frequency, we have a TX tone at roughly +14 dBm (measured separately) and a spur on the RX side at -50 dBm or an isolation of 64 dB. While the figure is very good, it’s much worse than LibreSDR that has ~20dB more rejection.
3.5.6. Rx Spurious reception
Spurious reception measures the noise at the RX output, in other words what leaks in the receive port and seen at the end of the receive chain. For this both TX and RX ports are terminated by 50R, and we perform FFTs on the RX while sweeping the RX LO.

RX spurious reception setup
Four configurations are tested:
RX only: The TX synthesizer is OFF
RX + TX Idle at Max TX Gain: the TX synthesizer is ON but not transmitting
RX + TX Idle at Min TX Gain: the TX synthesizer is ON but not transmitting
RX + TX Active: the TX synthesizer is ON and transmitting
Test conditions:
Configuration |
RF port |
TX1 / RX1 |
||
Sampling rate |
16.384 Msps |
|||
TX Tone frequency |
LO + 1 MHz |
|||
TX Tone level |
-6 dBFs |
|||
Tx Gain |
0 dB (max gain) |
|||
Tx LO |
600 MHz |
|||
Rx FFT size |
16384 |
|||
Parameter sweep |
Rx LO, Rx Gain |
|||
Initial condition:
If enabled the TX Gain is set to max, tone offset +1 MHz and LO = 600 MHz
Sweep:
Min and Max Rx Gains are tested
For each gain the RX LO is swept from 350 MHz to 3800 MHz
An FFT is performed every 5 MHz
At each FFT (~16 MHz wide) we take 5 MHz only on the positive side to avoid noise around the LO on the left or filter rolloff on the right. We then aggregate the 5 MHz chunks to form a wideband spectrum plot.
Test results:
3.5.6.1. RX only
At 0dB Gain, the whole frequency range is completely quiet. At 70dB Gain we see a wide range of spurs, some of them very strong. I have not had the time to investigate where they come from, but reaching the range of -30/-40 dBFs means they are quite strong. Since only the RX is ON and all ports are terminated by 50R they are very likely to originate from the device itself (eg RAM clocks…)
3.5.6.2. TX Synth ON - Max TX Gain
As soon as the transmitter synthesizer is turned on (max tx gain), we see a lot of spurs appearing. These will move around with the TX LO. We see a particularly strong VCO fundamental spur at 2.4 GHz (600 MHz x 4). At Maximum RX Gain it even reaches 0dBFs!
Hint
If you really care about RX performance, try to keep the TX fully turned OFF. One way is to put the RFIC in TDD mode, RX only.
3.5.6.3. TX Synth ON - Min TX Gain
By setting the Tx Gain to minimum we the level of spurs seen by the receive decreases significantly. This can be an alternative to shutting down the TX altogether.
3.5.6.4. TX Active
As expected if we turn on the TX, the spurs dramatically increase in level.
At 0dB RX Gain we the TX tone at 601 MHz at -52 dBFs and a whole range of other spurs (harmonics of TX LO/tone/VCO, clocks…)
At 70dB RX Gain the RX is quite simply saturated. Multiple spurs reach the level of 0dBFs. Zooming on 1800 MHz for example reveals a huge amount of distortion. Due to the external PA it is not possible to receive at max gain at the same time as we transmit at max power on this platform
3.6. TX tests
Danger
Unlike LibreSDR I could not run the TX tests at 0dBFs level: This would drive the external PA into compression, making measurement results invalid. This is shown in chapter Maximum output power
Unless otherwise specified, all TX tests are therfore run with a tone at -6dBFs
3.6.1. Tx Frequency response
This test measures the frequency response of the transmit chain
Test conditions:
Configuration |
RF port |
TX1 |
||
Sampling rate |
1.024 Msps |
|||
Tone frequency |
LO+100kHz |
|||
Tone level |
-6 dBFs |
|||
Tx Gain |
0 dB (max gain) |
|||
Parameter sweep |
LO frequency |
|||
Initial condition:
The device is set to transmit a tone at a frequency offset of +100kHz
The device is set to transmit at maximum level and gain
Sweep:
Frequency is swept and TX level in dBm is measured using a power meter at each step
Test results:
The output power varies from +14 dBm to +7 dBm, thanks to the external PA. There is still 7dB of variation across the whole range. So despite being much shorter than the LibreSDR TX path, it is still quite lossy.
3.6.2. Tx Gain
This test measures the Gain linearity of the transmit chain
Test conditions:
Configuration Parameter sweep |
RF port |
TX1 |
||
Sampling rate |
1.024 Msps |
|||
Tone frequency |
LO+100kHz |
|||
Tone level |
-6 dBFs |
|||
LO frequency, Gain |
||||
Initial condition:
The device is set to transmit a tone at a frequency offset of +100kHz
The device is set to transmit at maximum level
A reference measurement is taken at maximum gain
Sweep:
Frequency and Gain are swept, and tx power measured at each step
Gain is computed as difference between current measurement and reference measurement
Test results:
Similar to LibreSDR: the plots show that the gain is very linear from from -70dB to -20dB. Above -20dB gain we start showing a little bit of compression, and below -70dB we can’t backoff enough, especially at higher frequencies. But overall, good.
3.6.3. Tx Filter bandwidth response
Not measured, see Rx Bandwidth filter response, the response is expected to be identical
3.6.4. Tx LO leakage and Image
This test measures the LO and Image while transmitting a test tone
Test conditions:
Configuration |
RF port |
TX1 |
||
Sampling rate |
20 Msps |
|||
Tone frequency |
LO + 1 MHz |
|||
Tone level |
-6 dBFs |
|||
Parameter sweep |
LO frequency, Gain, Bw |
|||
Initial condition:
The device is set to transmit a tone at a frequency offset of +1 MHz
The device is set to transmit at maximum level
The sdr sampling rate is set at 20 MHz
Sweep:
Bw, Frequency and Gain are swept
At each step LO and Image are measured using the analyser
Test results:
LO: Values match datasheet for both 0dB attenuation (-50dBc) and 40dB attenuation (-32dBc).
Image: There is a pattern of degradation at very low and very high frequencies, as well as a degration around -50dB of gain.
3.6.5. Tx Harmonics
This test measures the transmit harmonics only, relative to the fundamental
Test conditions:
Configuration |
RF port |
TX1 |
||
Sampling rate |
1.024 Msps |
|||
Tone frequency |
LO+100kHz |
|||
Tone level |
-6 dBFs |
|||
Tx Gain |
0 dB (max gain) |
|||
Parameter sweep |
LO Frequency |
|||
Initial condition:
The device is set to transmit a tone at a frequency offset of +100kHz
The device is set to transmit at maximum level and gain
Sweep:
Frequency is swept, and harmonics are measured at each step. Fundamental is also measured
Note
my analyser could not measure higher than 6GHz
Test results:
Due to the external PA, the harmonics are generally worse than LibreSDR. For example there is a huge difference at 500MHz where we have H2 at -33dBc and H3 at -43dBc vs -66dBc and -51dBc for the LibreSDR.
3.6.6. Tx Spurious emissions
This test performs a wideband scan of the transmit port in an effort to measure all possible spurs. The test is done at fixed LO.
Test conditions:
Configuration |
RF port |
TX1 |
||
Sampling rate |
1.024 Msps |
|||
Tone frequency |
LO+100kHz |
|||
LO frequency |
513 MHz |
|||
Tone level |
-6 dBFs |
|||
Tx Gain |
0 dB (max gain) |
|||
Parameter sweep |
None |
|||
Initial condition:
The device is set to transmit a tone at a frequency offset of +100kHz
The device is set to transmit at maximum level and gain
Sweep:
No parameter is swept, we perform a wideband scan on the analyser side
Three configuration: Transmitter Active, Idle Max Gain, Idle Min Gain.
Test results:
3.6.6.1. TX synth ON, output OFF - Max Gain
The transmitter is ON but not actively transmitting. At Maximum gain we see mainly:
LO leakage at 513 MHz at -47 dBm (with quite a lot of phase noise)
VCO leakage at 2052 MHz: the VCO runs at 4x LO which is quite typical. The VCO is leaking at -31 dBm, which is incredibly high. 10dB higher than LibreSDR due to the PA.
VCO H2 at 4 GHz
Multiple harmonic of the TX LO
And various other smaller spurs
3.6.6.2. TX synth ON, output OFF - Min Gain
The transmitter is ON but not actively transmitting. At Minimum gain we see that all spurs are much lower and most LO-related spurs disappear. The VCO spurs still stand out as the strongest, but they are between 30-40dB lower compared to the maximum gain configuration.
Hint
This shows that if you must leave the TX ON but are not actively transmitting, set the gain to the minimum to minimize spurs
3.6.6.3. TX ACTIVE
We see exactly the same issue measured and explained in LibreSDR Tx Spurious emissions as we might think these are harmonics, but appear a lot higher than what was measured in Tx Harmonics. The LibreSDR chapter explains what they are.
3.6.7. Tx (baseband) intermodulation
Tx intermodulation was measured manually. The test is meant to show intermodulation products that appear at baseband level due to DAC and other baseband-related non-linearities.
If we transmit a tone at a certain offset \(+ \Delta f\) from the LO, we will of course expect an image at \(- \Delta f\). However, non-linearities in the baseband chain will also cause other spurs to appear. Specifically, in an IQ-based architecture, we will see odd-numbered spurs appearing on alternating side of the LO: if the wanted tone is at \(LO + \Delta f\), we will see a 3rd order IM product at \(LO - 3\Delta f\), 5th order at \(LO + 5\Delta f\), 7th order at \(LO - 7\Delta f\), and so on. Even-order spurs are normally significantly suppressed.
As their order increases, the amplitude of the spurs also decrease rapidly. Usually, only the 3rd and 5th order are prominent/can cause issues in a system
Test conditions:
Configuration |
RF port |
TX1 |
||
Sampling rate |
10 Msps |
|||
Tone frequency |
LO+500kHz |
|||
Tone level |
-6 dBFs |
|||
Tx Gain |
0 dB (max gain) |
|||
Tx LO |
1000 MHz |
|||
Parameter sweep |
None |
|||
Test results:
The spurs are illustrated in the manual measurement below. The span was limited to encompass up to the 5th order spur for better visibility. The highest spur in this example is the 3rd order product, approx. 44dB lower than the wanted tone (medium rejection).
We also see two unknown spurs near -100 kHz and +300 kHz, as seen on LibreSDR (not investigated yet)

Baseband intermodulation
Unfortunately, since these intermodulation spurs occur at baseband it is not possible to filter them out if they pose a problem. The only way would be to decrease the tone level at the digital stage, before the tone is synthesized by the DAC.
3.6.8. Tx to Rx isolation
See Rx Spurious emissions, 4th case.
3.6.9. Maximum output power
I initially tried plotting the Tx Frequency response with a tone level of 0 dBFS:
The red trace shows the power level advertised by the manufacturer here:
Plutosky Manufacturer TX data
As we can see the output lower is much lower than advertised.
Then, looking at gain, it becomes very clear that the PA is driven into compression:
Harmonics inevitably show significant degradation across the board:
The PA used is the Minicircuits PGA-102+. Looking at its datasheet, the output P1dB is +17.5 dBm Typ. and +16 dBm min., so technically anything north of +16 dBm would likely be compressing:
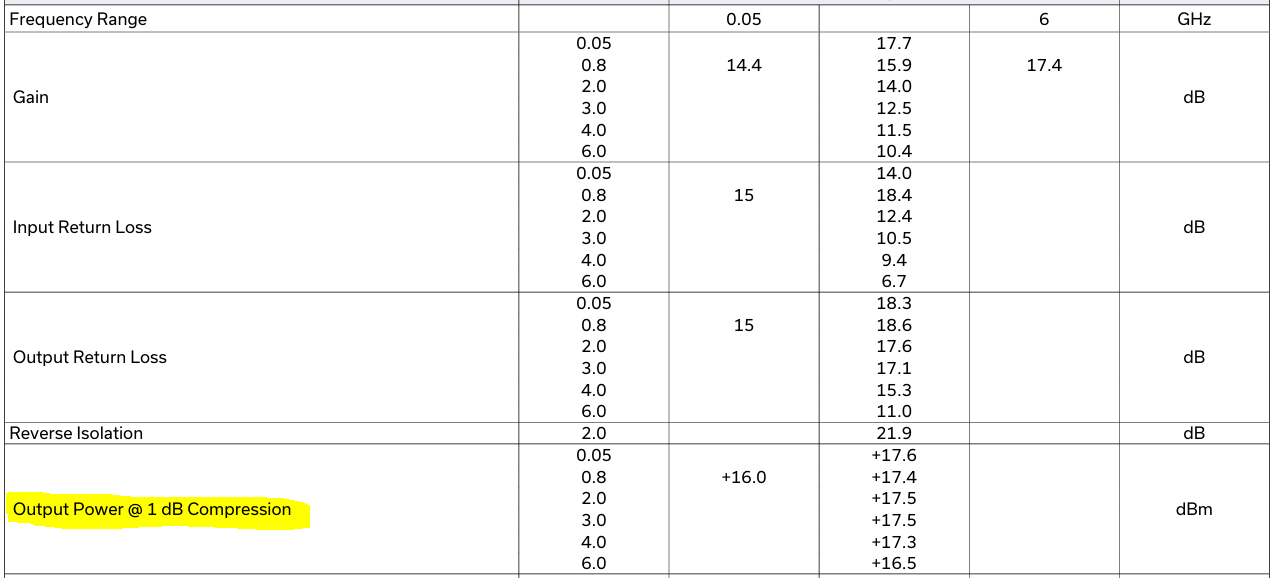
PGA-102+ Datasheet extract
Which also begs to question: how is OpenSourceSDRLab getting nearly +20 dBm at 1.6 GHz? If it’s even possible to reach that point the output would be so distorted it would be unusable.
To be in a “safe” region I would recommend to drive the TX in such a way to limit the output power to +14 dBm. Or simpler apply at least 6 dB of backoff to the baseband signal as was done throughout this report. You still end up with plenty of signal, but in a much cleaner operating point.
3.7. Conclusion
The device works as I expected. The TX and RX frequency responses are better than LibreSDR, and the extra power brought by the external PA is a nice touch.
However, that extra power does not come for free: harmonic and spurious content is significantly worse than LibreSDR. Additionally, the TX output cannot be driven at full power as the PA will be driven into compression. A minimum of 6 dB backoff is recommended to be safe.
The device also suffers from the same VCO leakage issue as LibreSDR.